

Author: Seoyeon Cho
February 9, 2021
1. Introduction
Since the beginning of 2020, the economies and social activities of global markets ground to a halt due to the rapid spread of the novel contagious disease caused by Coronavirus from Wuhan, China. Scientists named this virus as ”SARS CoV 2” and the disease it causes as ”Coronavirus Disease 2019” (COVID-19). SARS, also known as Severe Acute Respiratory Syndrome, is a disease that can be easily spread through surfaces and saliva. It was first identified in February 2003, and has reemerged since then. The World Health Organization (WHO) first declared the new outbreak as a public health emergency of international concern in January, 2020 but soon declared the crisis a pandemic as the virus spread exponentially in March, 2020. COVID 19 has now spread to more than 200 countries in the world and has caused 1.9 million deaths.
2: R script
This is an R chunk with no plots:
>sarsdataset <- read_csv("sars_2003_complete_dataset_clean.csv", + col_types = cols(Date = col_date(format = "%Y-%m-%d")))

>#View(sarsdataset)

>names(sarsdataset

[1]	"Date"	"Country"
[3]	"Cumulative number of case(s)" "Number of deaths"
library(readr)
[5] "Number recovered"

names(sarsdataset)[3]<-"CumNumber"

names(sarsdataset)[4]<-"Deaths"

names(sarsdataset)[5]<-"Recovered"

#install.packages("tidyverse")

library(tidyverse)

#install.packages("ggplot2")

library(ggplot2)

str(sarsdataset)
tibble [2,538		5] (S3: spec_tbl_df/tbl_df/tbl/data.frame)
$ Date	:	Date[1:2538], format: "2003-03-17" "2003-03-17" ...
$ Country	:	chr [1:2538] "Germany" "Canada" "Singapore" "Hong Kong SAR, China" ...
$ CumNumber:		num [1:2538] 1 8 20 95 2 1 40 2 8 0 ...
$ Deaths	:	num [1:2538] 0 2 0 1 0 0 1 0 2 0 ...
$ Recovered:		num [1:2538] 0 0 0 0 0 0 0 0 0 0 ...
- attr(*, "spec")=

.. cols(

..   Date = col_date(format = "%Y-%m-%d"),

..   Country = col_character(),

..Cumulative number of case(s)  = col_double(),

..Number of deaths  = col_double(),

..Number recovered  = col_double()

.. )

>sarsdataset$Country <- as.factor(sarsdataset$Country)

# Explore data for individual country

>

>list_Country<-levels(sarsdataset$Country)

>sarsdataset$Country <- as.factor(sarsdataset$Country)

>rev(sort(table(sarsdataset$Country)))[1:5]
Thailand	Singapore Hong Kong SAR, China
96	96	96
Germany	China
96	96
>Country0<-list_Country[11]
>countryindexes<-c(6,11,27)
>countryindexes<-c(1:length(list_Country))
>list_Country[countryindexes]
[1]	"Australia"	"Belgium"	"Brazil"
[4]	"Bulgaria"	"Canada"	"China"
[7]	"Colombia"	"Finland"	"France"
[10]	"Germany"	"Hong Kong SAR, China" "India"
[13]	"Indonesia"	"Italy"	"Japan"
[16]	"Kuwait"	"Macao SAR, China"	"Malaysia"
[19]	"Mongolia"	"New Zealand"	"Philippines"
[22]	"Poland"	"Republic of Ireland"	"Republic of Korea"
[25]	"Romania"	"Russian Federation"	"Singapore"
[28]	"Slovenia"	"South Africa"	"Spain"
[31]	"Sweden"	"Switzerland"	"Taiwan, China"
[34]	"Thailand"	"United Kingdom"	"United States"
[37]	"Viet Nam"
With Sweave files, there is only one figure per chunk
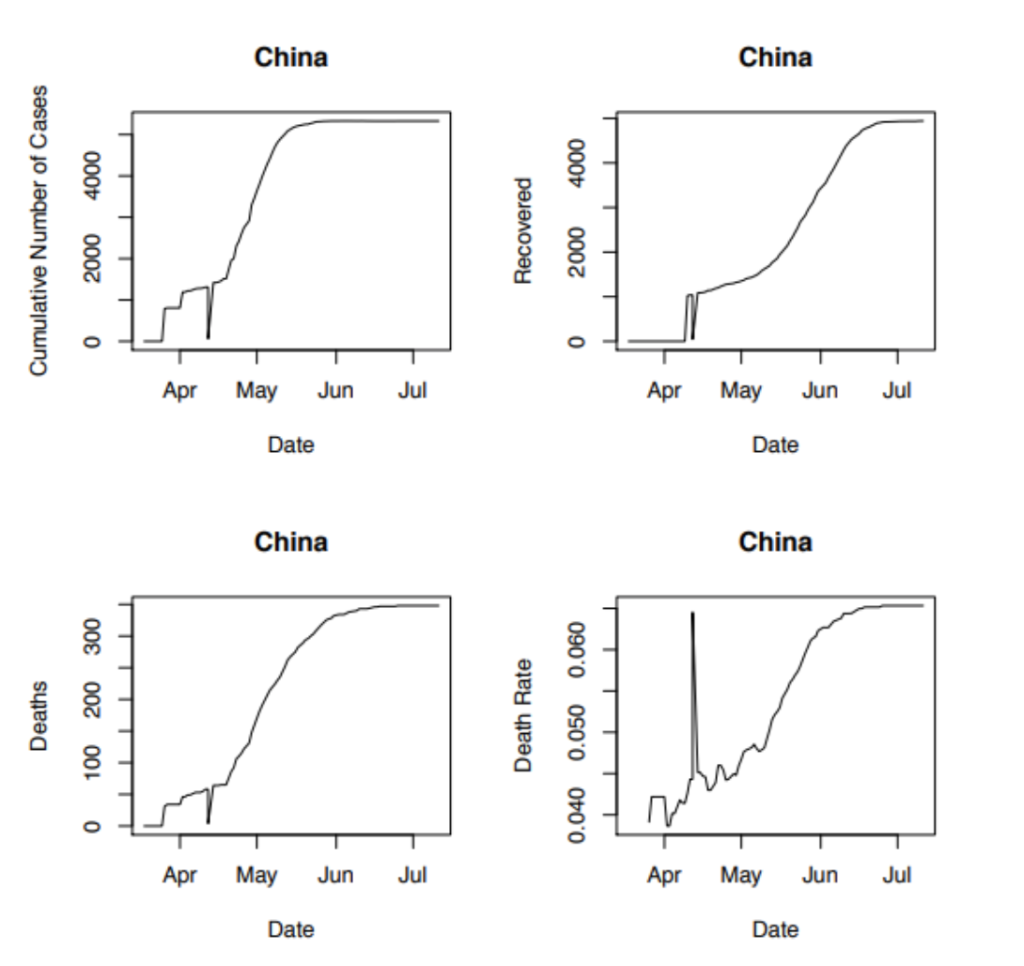
countryindexes<- c(6)

for (j in countryindexes){

+   Country0<- list_Country[j]

+ sarsdataset0<- sarsdataset[ sarsdataset$Country== Country0,] + #print(sarsdataset0)

+ #ggplot(data=sarsdataset0, aes(x=Date, y=CumNumber)+ geom_line()

+

+ par(mfcol=c(2,2))

+ plot(sarsdataset0$Date, sarsdataset0$CumNumber, type="l",

main=Country0,

xlab="Date",

ylab="Cumulative Number of Cases")


plot(sarsdataset0$Date, sarsdataset0$Deaths, type="l",

main=Country0,

xlab="Date",

ylab="Deaths")

+

plot(sarsdataset0$Date, sarsdataset0$Recovered, type="l",

main=Country0,

xlab="Date",

ylab="Recovered")

+

plot(sarsdataset0$Date, sarsdataset0$Deaths/sarsdataset0$CumNumber,type="l",

main=Country0,

xlab="Date",
ylab="Death Rate")

}
3. From Google Docs
Background information
The purpose of this research paper is to critically understand the past situation of the SARS outbreak in 2003 with the objective of projecting the near future conditions of the COVID 19 crisis. This effort com-pares and contrasts quantitative information available from the two crises. It now has been almost a year since the outbreak started with significant impacts on human beings all over the world but to date, there have been no significant improvements or comprehensive solutions in countries of the world. The critical, analytical understanding of the SARS outbreak presented in this paper, improves the potential to better predict possible outcomes of the COVID 19.
4. Research Topic
4.1 Issues
Contrasting each country and analyze the SARS impact * examining the progression of disease in each country Interesting points that may arise: * Death rates may be higher in lower income countries * World Health Organization classifies countries by geography and by income level; perhaps there are patterns in expo-sure levels and death rates * When comparing progression of disease by country, accounting for different population sizes of the countries (focus on percentage increases/changes) and possibly residential density of countries. * Degree of government control on quarantines and isolation of active cases.
4.2 Connection between the covid and SARS
- Countries that experienced SARS were possibly better prepared to deal with COVID-19 (e.g., testing protocols and other .)
SARS – data, analysis (organized discussion with logical flow) (list the actual number on the data)
5. Plots from GGPlot
6. Analysis
The similarities between the countries that had most death rates.
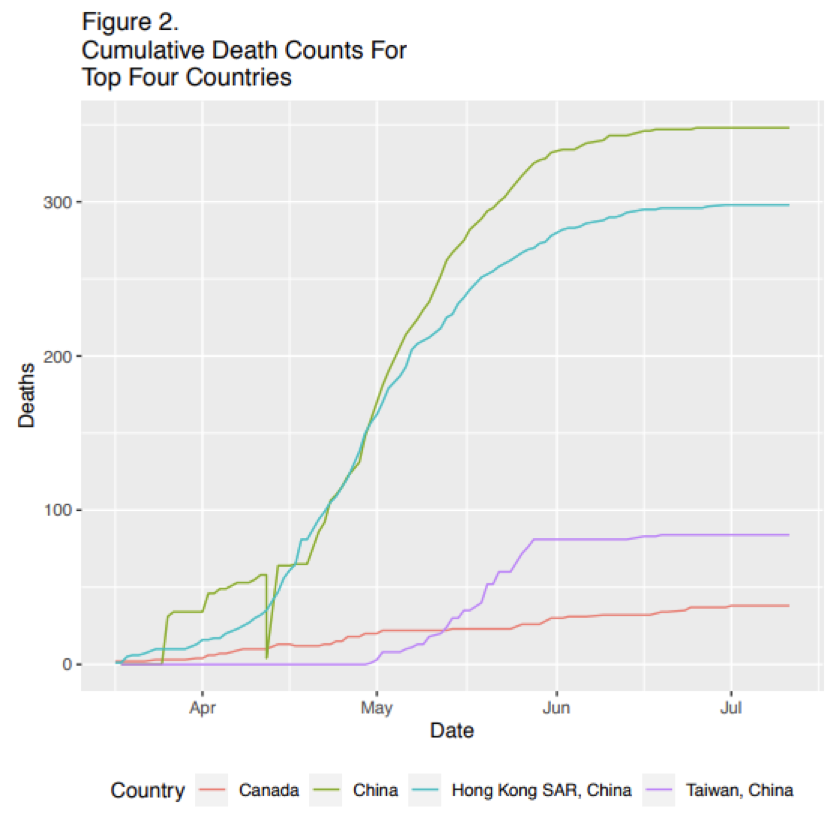
This graph indicates the death rates of different countries along the time due to the impact of SARS outbreak back in 2003. One can easily notice the highest deaths has been recorded by China, second by Hong Kong, third by Taiwan, and fourth by Canada.
One can also notice that these four countries can be grouped into two parts , where one has recorded relatively significant number of deaths and another with less significant death rate. China and Hong Kong can be grouped as ”most death rate” group whereas Taiwan and Canada can be grouped as ”non-significant death rate” group. This separation could have been done easily because of the distinct difference in the number of deaths.
The very distinct similarities that ”most death rate” group shared was the exponential growth of number of death from April to late May. The green and blue graphs showed almost an identical exponential growth during that time span and slowly stopped increasing and remained almost constant from June to July with constant death rate of 380 and 300 for China and Hong Kong respectively.
Other than the information from given graph, one can also assume that the ”most death rate” group were similar in a sense that they were both sharing / touching the border of China. This may be very obvious and does not seem like an important fact but can’t be ignored as both SARS and COVID-19 were emerged in China and spread to other countries rapidly. (Add another graph with percentage deaths (death rate) as a percent of cases to compare countries)
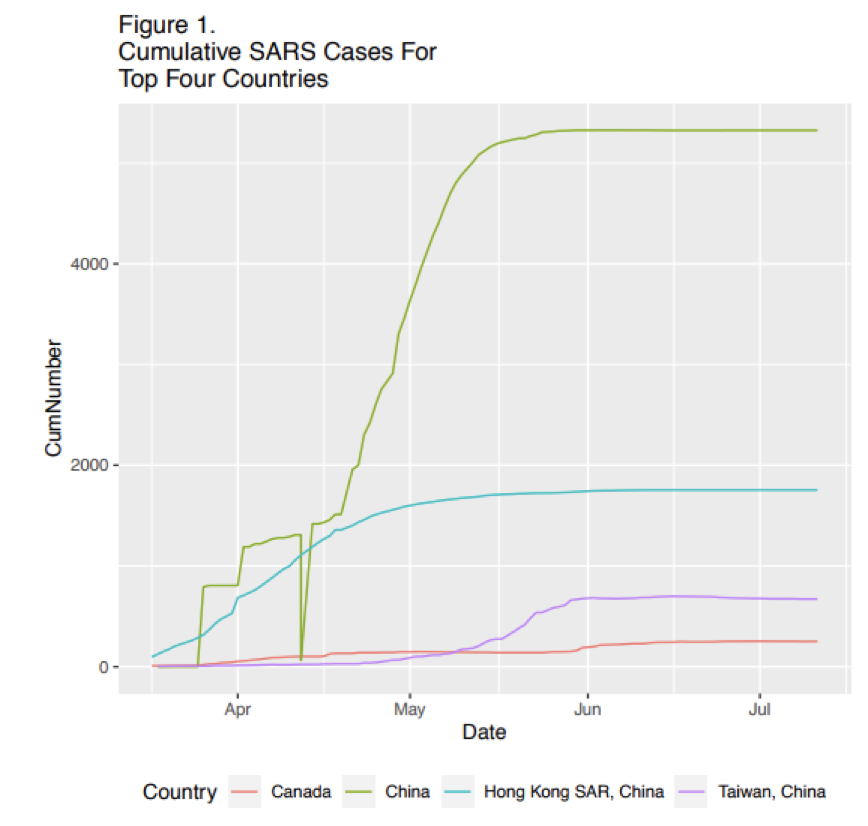
The similarities between the countries that did not have many cases From the figure 1, one can also notice the similarities between the countries that did not have such high death cases; Taiwan and Canada. It is that compared to ”most death rate” group, the increase of the death case of these two countries was not very exponential but quite steady. Canada showed very linear increase of death cases along time and Taiwan with small exponential growth during May but not as significant as that of China or Hong Kong.
The another distinct similarity that one can know is that these two countries, Canada and Taiwan, are not touching China’s national border directly. There may be a lot of Chinese immigrants in Taiwan and Canada but they both are not directly touching China in terms of country’s borer line.
7. Worst Experienced Country
In order to pin down which country experienced the worst outbreak, one has to define ”worst experience” first. This is important because one could think the country with most death cases had the worst experience whereas another can argue that the worst experience should be based on the percentage of number of death per national population. In this report, the ”worst experience” will be based on the total number of SARS case. This is because the absolute amount of people who suffered from this disease matters more than the numbers of death rate or the number of deaths. According to figure 2, it is clear that China had the highest cumulated number of SARS case among 4 countries with overwhelming 4800 cases, almost the double of Hong Kong’s SARS case
8. Worst Impacted Country Among Top Rated Countries
Just like how ”worst experienced” was defined in the past paragraph, ”impact” will be defined as how much of a shock SARS brought to a country. In other words, ”impact” will be measured based on the percentage of death per the nation’s population.
Taiwan: 24 mil Canada: 38 mil Hong Kong: 7.5 mil China: 1.4 bil
Even without the detail calculation, one can see that the death / nation pop-ulation is the highest for Hong Kong as it has the smallest number of population but almost the same number of death cases according to figure 1. Therefore, one can argue that Hong Kong had the worst impact among the four given countries.
9. Seriousness of SARS Crisis
Unlike other diseases like cancer or heart disease, the problem with SARS was the fact that this disease was so contagious. This is important because person with cancer or heart disease can live their normal life even after recognizing they have those diseases. However, in case of SARS, the other people who do not carry the disease cannot function properly because of the fear that this unseeable virus might be traveling as an aerosol in mid air and infect them. This fear cannot be sorely explained or quantified with graphs and numbers on figures. Which also explains why the numbers and the figures can not properly explain the seriousness of SARS. SARS did not only kill people but killed the economics of not only these four countries but the many other countries who were closely related to China. Obviously, the death of many people is a deep pain that can not be forgotten but the economic damage that SARS caused was very significant.
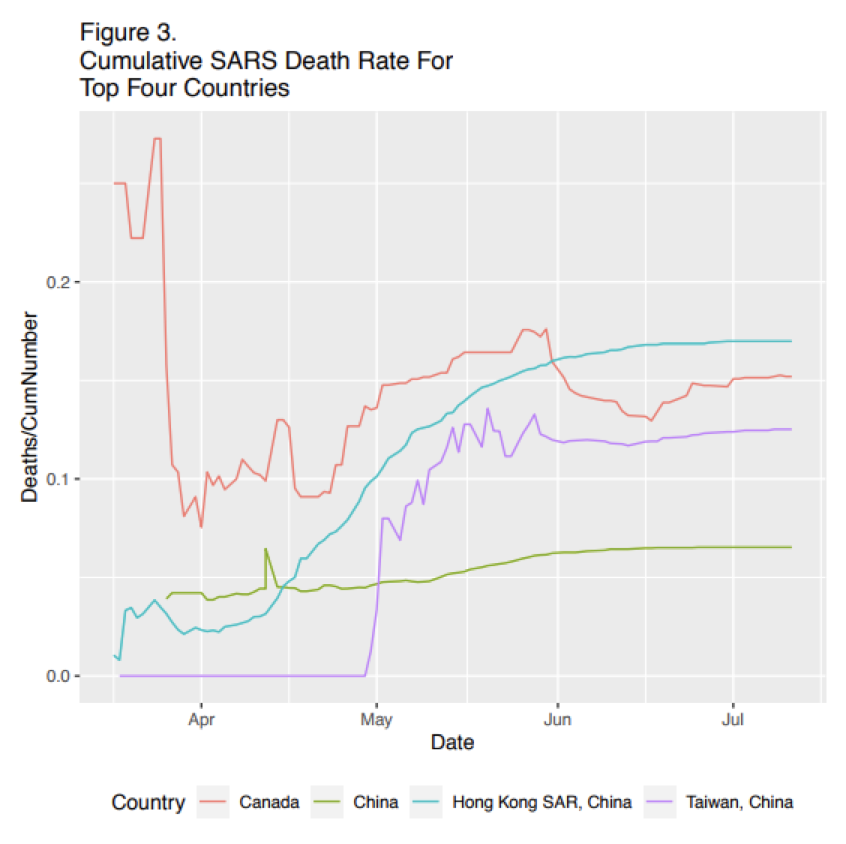
From figure 3, one can distinguish the differences and similarities between four countries.
First of all, Canada showed a very distinctive characteristic that other 3 countries never shown. During the late February, the deaths/cumnumber of Canada spiked all the way up to 0.3 but it soon died to 0.1 and slowly increased and remained constant at about 0.15. This kind of instant spike, decrease and remaining of the rate has not been shown in any other countries. The other two countries, Hong Kong, and Taiwan, never shown an instant spike like Canada did but rather slower exponential increases. However China has shown a very different rate graph as well. China was the only country that had linear increase among 4 countries in figure 3.
For the death rates why does death rates stop dramatical increases during June?
From the figure 1, one can see that the exponential growth of death rate for China and Hong Kong has been remained until early June but the growth has significantly died from June. A lot of reasons could be the answer to this dra-matic ease of SARS such as the change of weather, countless efforts of scientists, researchers, and doctors to stop the disease. As all four countries’ death rate has decreased dramatically as time went by, one could assume that the obvious change of weather (from winter to summer) along time has helped the human population to stop the contagious disease, SARS. Another reason for a sudden ease of exponential growth of SARS would be the fact that all four countries’ governments were well aware of the situation with the help of WHO and well managed to stop the spread of virus.
There could be multiple reasons for a stop of dramatical increase during June. One is the change of weather from winter to summer and the increased temperature. Another is the cumulated effort of human beings to stop the virus with research for cures and governments’ desperate effort to stop people from going out.
The country that had most severe crisis and what happened to their country Among these four countries, Hong Kong had the most severe crisis with the highest percentage of both death and cumulated case number per nation’s pop-ulation. The death rate of SARS case in Hong Kong were usually around 20% but it went up close to 55% among elders.
Because other normal respiratory diseases’ death rate were about 1% back then, the SARS did not seem to be a significant issue at the beginning of the outbreak. However, the death rate was significantly high specifically in Hong Kong since they were most vulnerable to the disease as they had the highest portion of elders among the four given countries in the data. This was a very significant fact that changed the SARS’ outcome back in 2003. Furthermore, Hong Kong was not very well prepared for these kind of outbreaks as they have one of the highest population density in the world which meant Hong Kong was the best possible option for SARS outbreak to exponentially damage the country and the economics of it.
Due to SARS outbreak in 2003, Hong Kong’s tourism industry had to face the worst period so far. As you could imagine, with this outbreak ongoing in Hong Kong, no one in other countries would have voluntarily wanted to visit and explore Hong Kong because of the SARS. According to Paul Chan Mo Po, finance minister of Hong Kong in 2003, the number of foreign visitors decreased to 40% compared to that of 2002. This kind of economic impact did not only hurt the tourism industry but the local and international economics of Hong Kong as well. This damage was more severe for Hong Kong since they had such a dense country compared to others like Canada or China in terms of both landscape and population density. It completely frozen the economics and the country and took years of effort for Hong Kong and their people to recover from SARS.
10. Prediction
Compare the conclusion of sars and the current cove pandemic SARS could have been completely controlled within only 6 months of time with international effort back in 2003 but the current ongoing COVID 19 pandemic already has surpassed 12 months of time and does not seem to end in the near future. This could be explained with the fact that back in 2003, the world was not as connective as it is now. For instance, traveling was treated as a huge privilege back in 2003 and was not a very common. However, as the world started to globalize exponentially, traveling was not a big privilege for mange people and became common for everyone in 2021. One can believe that the significant reason why SARS could have ended much faster, only in 6 months, compared to COVID was because it was not as globalized back in 2003 as it is now in 2021.
SARS ended only in 6 months and only caused 774 deaths but the current COVID already has killed more than 1.9 million people internationally all over the world. It is very distinct that the SARS was only spread to few countries whereas COVID has been spread to more than 200 countries. This may be the reason why COVID is not concluding like how SARS has concluded, the exponent globalization of the world.
11. Comparison Between SARS and COVID 19
SARS and COVID 19 share the very same virus called coronavirus which is very contagious and causes respiratory diseases. These two also are very similar in a sense that these diseases are much more dangerous for elders or one with existing diseases like obesity, cancer or respiratory disease than others.
It is also similar how the outbreak originated from China and spread to other close countries. As Hong Kong is literally next to China and easy to travel, the virus was able to spread in Hong Kong rapidly just like how COVID19 had spread in Hon Kong as one of the earliest countries in the first several months of the outbreak.
12. Conclusion
In conclusion, the SARS and COVID 19 share the very similar characteristic in a sense that both of them are caused by coronavirus, are very contagious, and are dramatically more dangerous to elders and people with existing diseases. Back in 2003, people were able to successfully stop the SARS as the world was not as globalized as it is now with efforts of scientists, researchers, doctors, and the governments as the virus only spread to few countries. However, the COVID19 now has been spread to more than 200 countries and caused almost 2 million deaths. From the close observation of SARS case, one can conclude that it has surpassed singularity point but the time, effort from researchers and governments will stop this COVID19 in foreseeable future.
13. References
Seladi-Schulman, J. S. S. (2020, April 2). COVID-19 vs. SARS: How Do They Differ? Healthline. https://www.healthline.com/health/coronavirus-vs-sars
Severe Acute Respiratory Syndrome (SARS). (2019, November 1). World Health Organisation. https://www.who.int/health-topics/severe-acute-respiratory-syndrome
E.P.M.K.U.G.D.H.H.N.P.F.C. (2020, July 3). Comparing SARS-CoV-2 with SARS-CoV and influenza pandemics. The Lancet. https://www.thelancet.com/journals/laninf/article/PIIS147 3099(21)00054-2/fulltext
About the author