

Author: Simran Darak
Symbiosis International School
September 30, 2021
Abstract
Successful execution of every business startup / matured business enterprise depends entirely on management skills and expertise of the executive group of an organization. The business venture can, therefore, conceive modifications of how to move towards the modern intricate and changing situation for success in the market. Therefore, the executives of an organization try to revolutionize their methodology during pessimistic moments, to guarantee lasting and long-standing success of the business enterprise. They are required to continuously maintain and get hold of clients and vendors. By putting into practice these measures they can achieve a competitive advantage over other business enterprises.
This project report entitled “A study on financial performance of Infosys Technologies Ltd”. The main objective is to analyze the financial position of the company based on the relationship between the items of balance sheet, profit and loss account and cash flow statement to make investment decisions. All the financial data has been gathered from financial sites which form the secondary data. Various tools used to carry out the study are ratio analysis, comparative financial statements, histograms, graphs etc.
The study concludes with a recommendation for investing in the company as a long-term investment, keeping in view the stable and gradual growth of the company since inception.
Introduction
Financial statement analysis is an essential step towards decision making as regards investing in a company stock, if analysis is not done one lands up in a game of chance.
Companies’ financial statements (Balance Sheet, Profit & Loss, Cash Flow statement, and the statement of owner’s equity) give us advice which as a combination provide a true financial picture of the company’s deep pockets.
Different analysis methods can be employed to evaluate the intrinsic value (true value) of the company stocks based on the past, present, and predicted future financial performance of the company.
On completion of the analysis, the information can be utilized to decide as regards investing in the company with a positive speculation of the expected target returns.
Choice of Company/Sector
Infosys Technologies India was chosen among the peers of Infosys Technologies, in the Information and Technology sector in the Indian Stock Market.
Infosys Limited (Background)
Mr. N R Narayana Murthy and 6 software professionals established a software startup company in the year 1981 with an investment of only Rs10,000/- in Pune India.
Relocated its headquarters to Bengaluru in 1983 and subsequently opened its first office in BOSTON USA.
The company got ISO9001 certification in 1993.
Infosys went public by issuing an IPO at Rs 145/- per share.
Infosys team made arduous efforts and is now one of the leading IT services companies in India.
Now has several fortune 500 companies on its client list.
Infosys’ Mission Statement
“To achieve our objectives in an environment of fairness, honesty, and courtesy towards our clients, employees, vendors and society”
Infosys’ Vision Statement
“To be a globally respected corporation that provides best-of-breed business solutions, leveraging technology, delivered by best-in-class people.”
Infosys Tagline
“Powered by Intellect, Driven by Values”
Assessment Of Intrinsic Value of Share Price
(To help Investment Decision making)
Following data pertaining to the company was compiled:
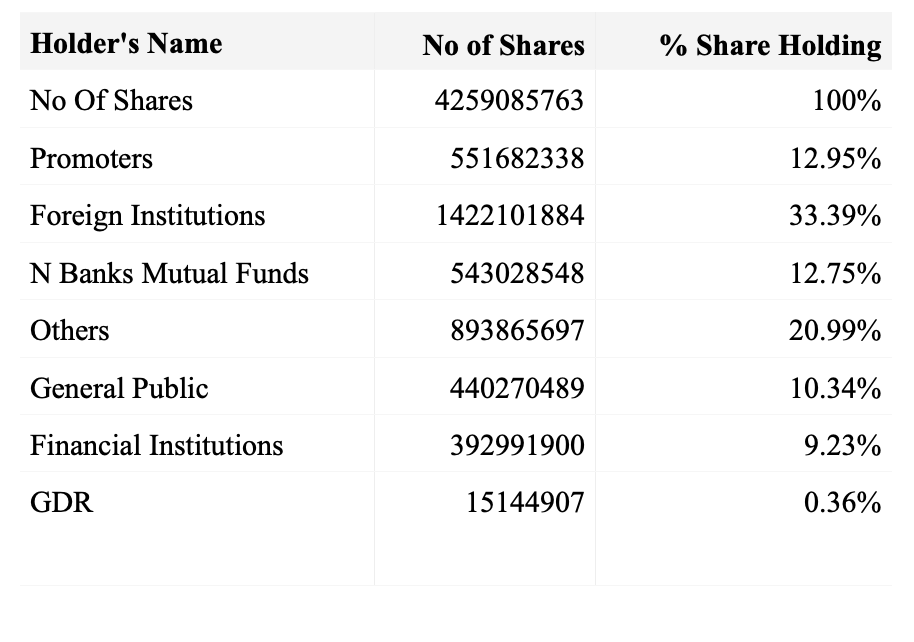
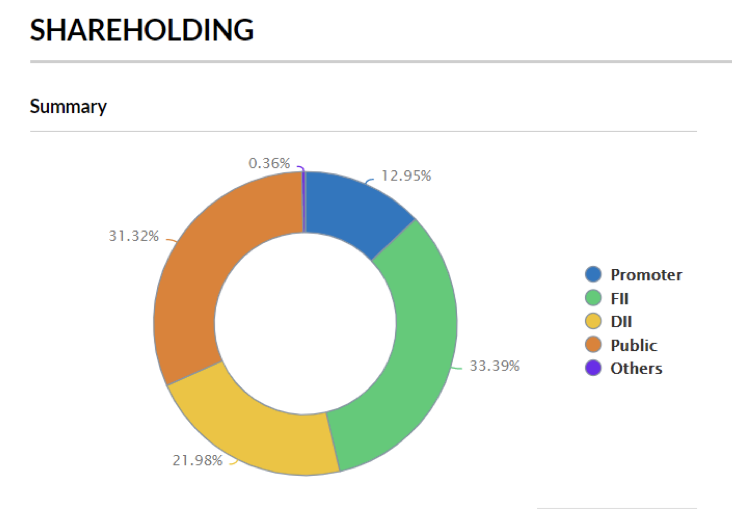
Remarks
Distribution of the share holding pattern shows a good presence of institutional investors which indicates that promoters have no opportunity to change or make random decisions which can benefit the promoters without analyzing how it would affect the earnings and the shareholders.
Comparison with peer IT companies
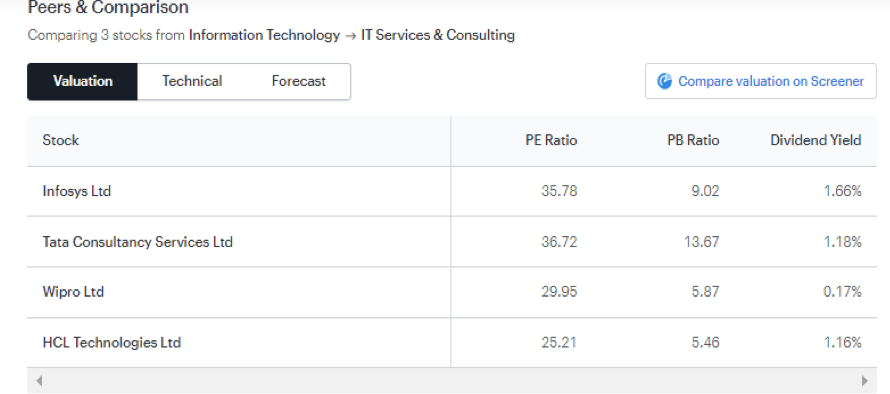
Remarks
P/E Ratio
A high P/E suggests that investors are expecting higher earnings growth in the future compared to companies with a lower P/E.
The table shows the P/E ratio of Infosys is 35.78 standing near to TCS which has a P/E ratio of 36.72 and is sufficiently higher among its peers, as such it will not be wrong to expect a higher growth rate of Infosys technologies in the period ahead.
P/B Ratio
P/B ratio is a useful metric of the ratio of price of share to its book value. It provides comparison of the company’s market capitalization to its book value. The P/B ratio of Infosys as per the data is 9.02 second highest among its peers and a good indicator to BUY a share.
Dividend Yield
The dividend yield–displayed as a percentage–is the amount of money a company pays the shareholders for owning a share of its stock divided by its current stock price. The comparison shows the dividend yield of Infosys as 1.66%. This higher percentage of dividend indicates that Infosys is paying more to its shareholders as compared to its peers which is an indication that the company is at its maturity level and its growth is stable.
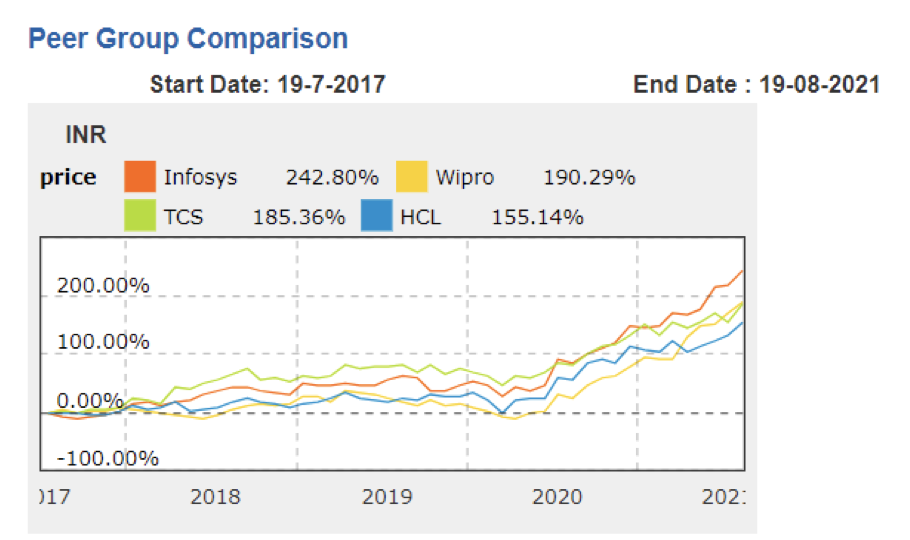
Peer group comparison for the past five years beginning from July 2017 to August 2021 shows that Infosys stock price has steadily grown in comparison to its peers which indicates the stability of the company.
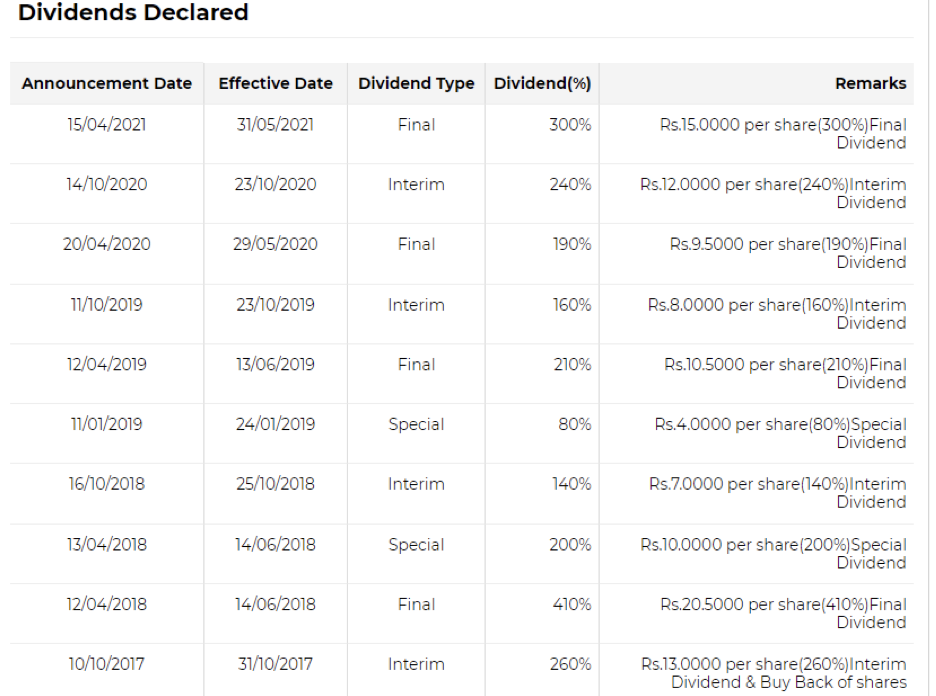
Dividend Record
Dividend per share (DPS) is an important financial ratio which indicates the financial health and long-term growth prospects of a company.
A steady and growing dividend payment by a company indicates the stability and growth of a company.
DPS is an important metric from investors point of view because the amount a firm pays out in dividends directly translates to income for the shareholder.
DPS is one of the most straightforward figures an investor can use to calculate his or her dividend payments from owning shares of a stock over time. A growing DPS versus time also implies that the company’s growth and earnings can be sustained.
As such the dividends record of Infosys gives a very positive signal to invest in the company, as depicted in the table below.
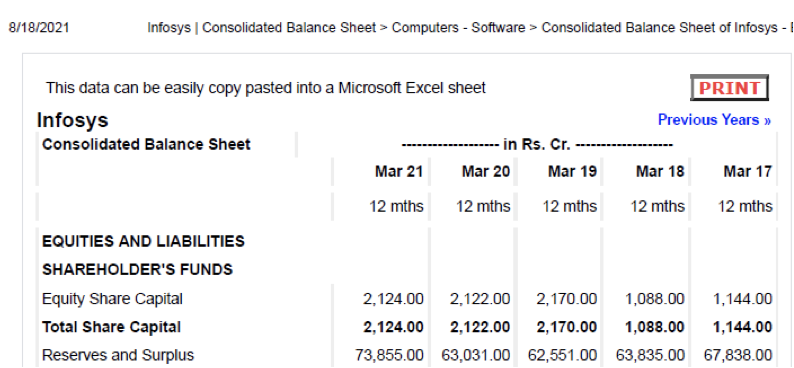
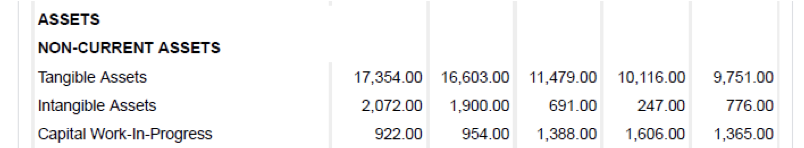
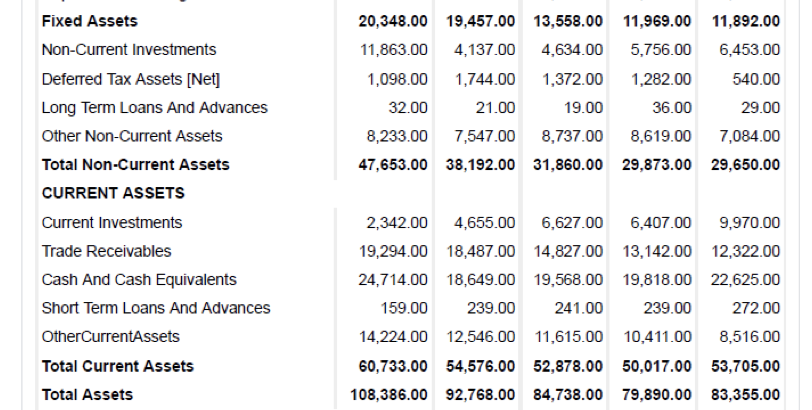
Balance Sheet / Income Statement Analysis
- A company’s balance sheet shows its assets and liabilities at glance.
- Analysts study the balance sheet to make decisions pertaining to an investment opportunity or evaluating a company.
- It is believed that the most important areas on a balance sheet are cash, accounts receivable, short-term investments, property, plant, and equipment, and other major liabilities.
- The top line and bottom line are two of the most important lines on the income statement for a company. Investors need to pay attention to any changes in these from quarter to quarter and year to year.
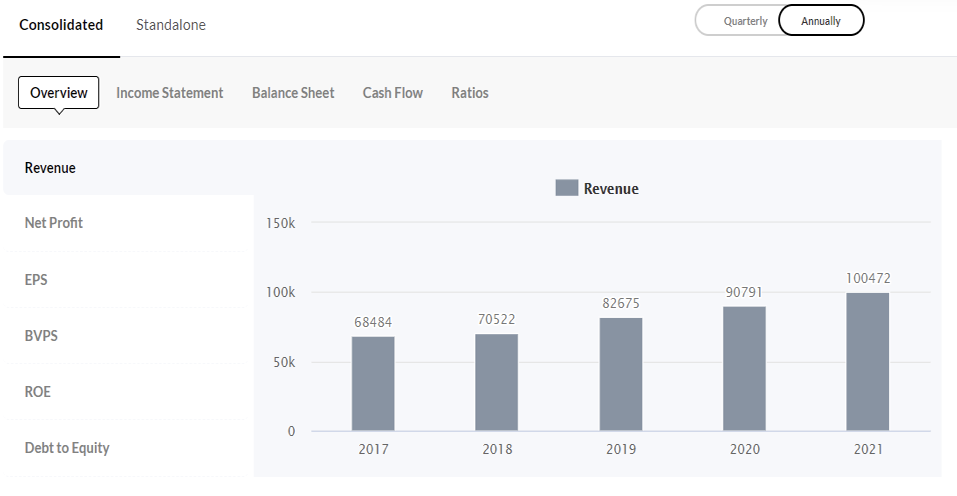
- The top line refers to a company’s revenues or gross sales. Therefore “top-line growth,” indicates an increase in gross sales or revenues.
- The bottom line is a company’s net income, or the “bottom” figure on a company’s income statement. Thus, the bottom line shows a company’s income after all expenses have been deducted. These expenses include interest charges paid on loans, general and administrative costs, and income taxes. This is also referring to as net earnings or net profits
- Other critical items include accounts receivable, short-term investments, property, plant, and equipment. and major liability items. The big three categories on any balance sheet are assets, liabilities, and equity.
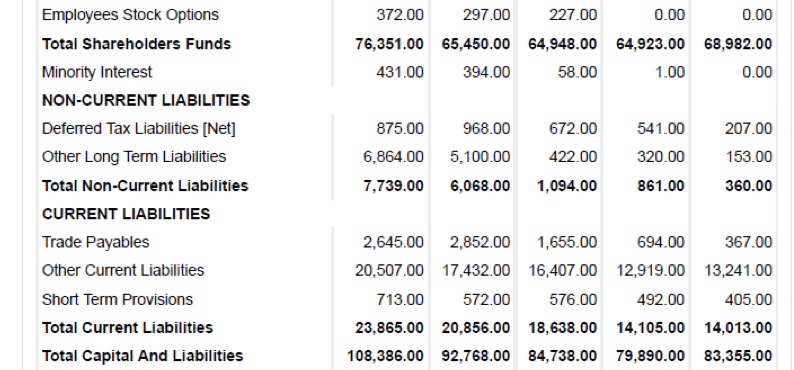
BALANCE SHEET
Ratio Analysis
Liquidity ratios
These ratios indicate whether the company would be able to pay its short-term debts
when they are due. They give a picture whether the company has sufficient cash and cash equivalents to pay its short-term debts. The value of the ratio greater than ONE shows that the company is in good financial health.
The ratios help in determining the liquidity of a company:
Current ratio:
This tells us whether the company has sufficient funds to pay its liabilities over a period of 12 months.
Current ratio = Total Current assets / Total Current Liabilities
= 60733 / 23865
= 2.55
The value of current ratio of 2.55 indicates that the current assets of Infosys are 2.55 times
its liabilities. This means that the company is in good financial state to pay back its liabilities.
Quick ratio/acid test ratio:
It measures the current short-term ability of the company to pay its liabilities.
It considers the very liquid assets (can be converted into cash immediately).
Quick Ratio = (Total Current Assets – Inventory) / Total Current Liabilities
= (60733 – 0) / 23865
= 2.55
Quick Ratio also measures the company’s liquidity position. A ratio 2.55 indicates that the company’s financial position is sound. This is also termed as Acid test Ratio.
Cash ratio
Cash ratio further improves the current ratio and quick ratio.
It considers only the most liquid short-term assets of the company.
It is the most rigid measure among the three liquidity ratios.
Cash Ratio = Cash and Cash Equivalents / Current Liabilities
= 24714 / 23865
= 1.04
The cash ratio shows the immediate capacity of the company to pay off its current liabilities. A ratio of 1 means that the company has the same amount of cash and cash equivalents as it has current debt.
Profitability ratios
Gross profit margin/gross margin is a financial metric that shows how competent a company is at managing its operations. It is a ratio that indicates the performance of a company’s revenues based on the efficiency of its production process (COGS – Cost of Goods Sold). This ratio is valuable to the management of the company as well as the investors.
Gross Profit Margin = (Revenue – COGS) / Revenue
= (100472 – 70369) / 100472
= 0.2996
= 29.96 %
Gross Profit Margin indicates the efficiency of operation of the company, 29.96 % is sufficiently a good profit margin.
Net Profit Margin measures how much profit is generated as a percentage of revenue. It shows how much of each rupee collected in revenue is converted into profit.
Net Profit Margin = Net Profit / Revenue
= 19423 / 100472
= 0.1933
= 19.33 %
Operating profit margin
This ratio specifies how much profit a firm makes after paying for variable costs of production such as wages, raw materials, etc. but before interest and tax
Operating profit margin =EBIT/ Revenue
= 26628 / 100472
= 0.265
= 26.5 %
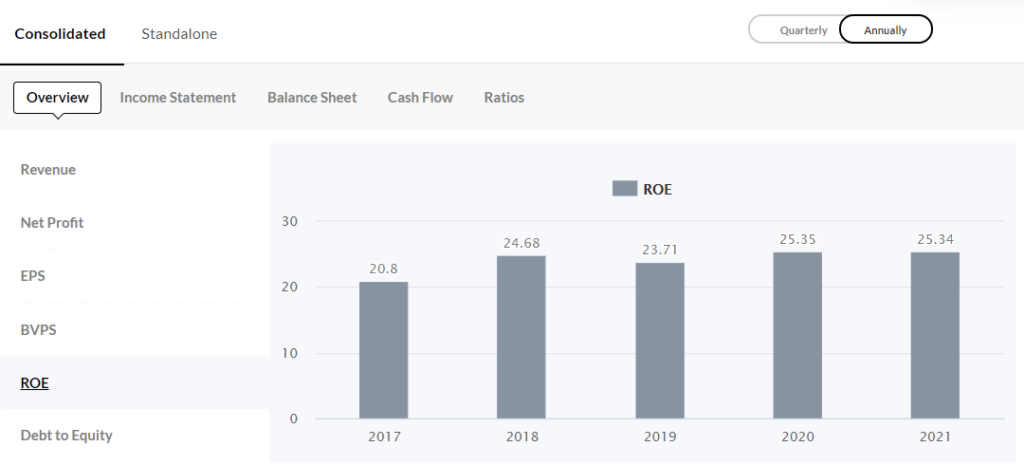
Graphical Representation of Financials from the Profit & Loss Statement
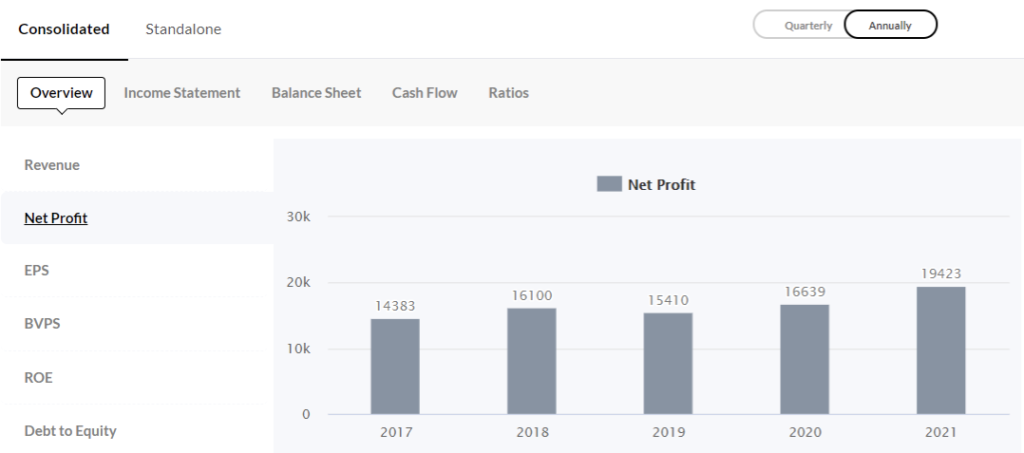
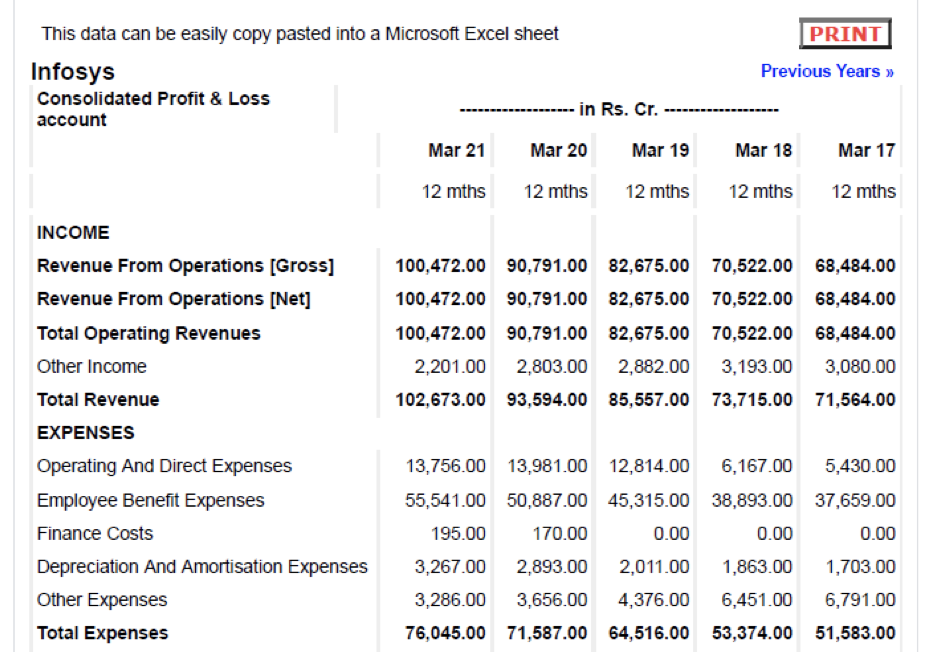
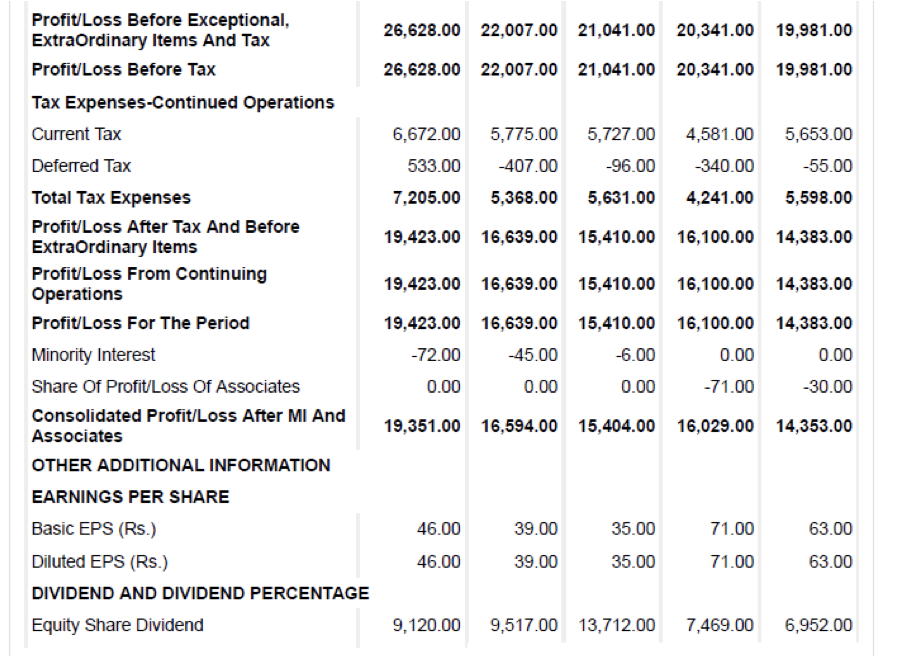
NET PROFIT – for financial year 2020-21 = 19423 Crore Rupees
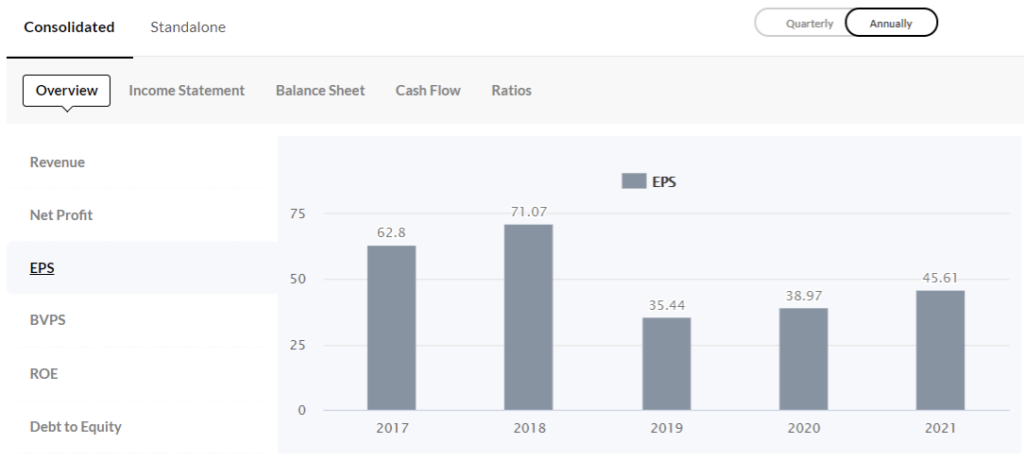
EARNING PER SHARE (EPS) – for financial year 2020-21 = 45.61 Rupees
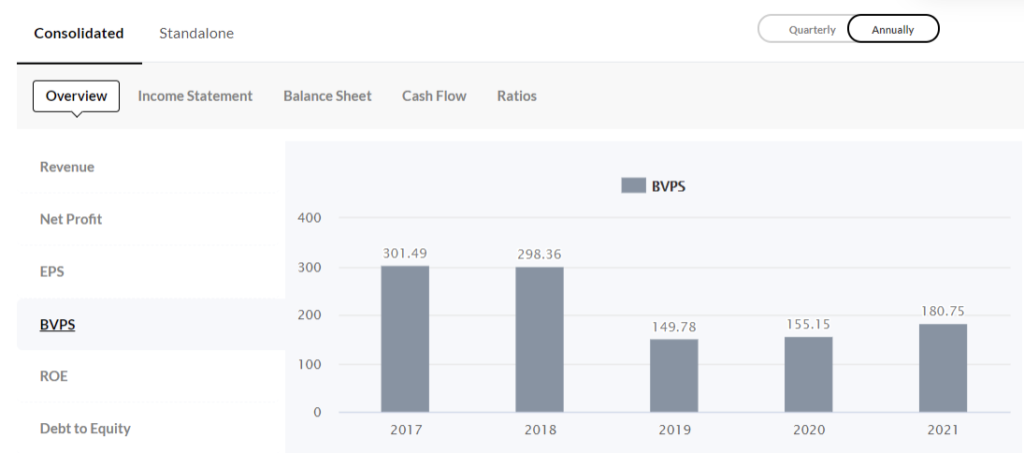
BOOK VALUE PER SHARE – for financial year 2020-21 = 180.75 Rupees
Profit and Loss
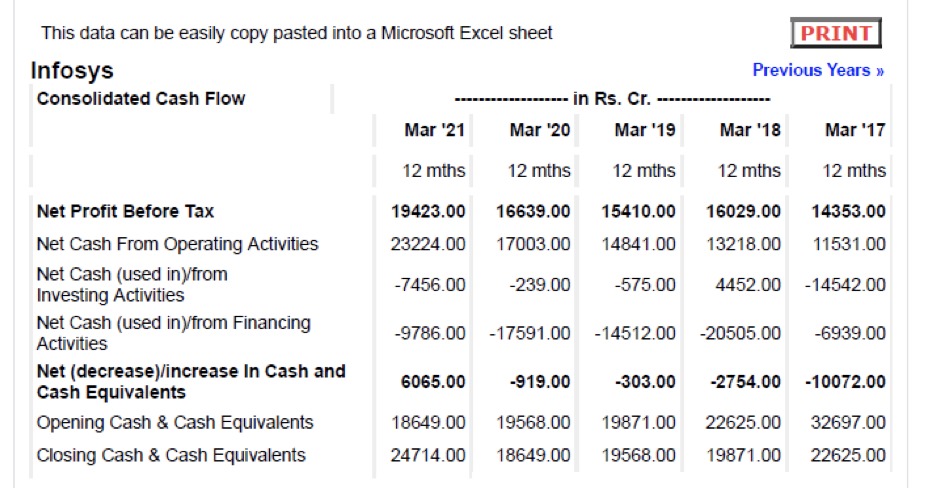
Cash Flow
Macro-economic Factors Affecting Stock Market and Investor Decisions
Introduction:
To assess the financial health of a company one needs to carry out fundamental analysis of the company. An insight to the trend of the stock (i.e., its price variations) is provided by technical analysis.
But an investor cannot ignore the macroeconomic factors which directly or indirectly affect the stock market and in turn the price of stocks.
Awareness of an investor in this respect can enable him to minimize (loss) or maximize(profit)
The main macro factors which affect the stock market are: –
- Economic Growth
- Unemployment
- Inflation
- Interest Rates
- Exchange Rate
ECONOMIC GROWTH
Economy’s health has a direct impact on the stock market, which implies if put mathematically the company’s and the stock market variation is in direct proportion. Thus, with economic growth the companies expand and increase their profits which in turn can increase the share prices vice versa.
A strong economy builds the confidence of an investor to invest in equity market, whereas if the economy is poor investors tend to protect their capital by hedging their investments.
UNEMPLOYMENT
When there is an increase in the rate of unemployment, the consumers will have the tendency to spend on only essential items. As a result, this will directly affect the earning capacity of the companies which in turn affect the stock market.
INFLATION
Inflation means that there is a rise in the prices of goods and services which means that the consumers have less money to spend on non-essential items because inflation lowers the purchasing power of currency over time.
Inflation in turn affects the business and their profits as the input cost increases, which in case absorbed by the company reduces their profit.
INTEREST RATES
Increase in interest rates reduces the borrowing capacity of a company which will hinder the ability of the growth of business. Also rising interest rates affects the consumers as they must pay more interest on mortgage / personal loans which reduces their purchasing power.
EXCHANGE RATES
A reduced exchange rate results in cheaper exports which in turn increase the demand of exported goods. This raises the profit of companies involved in export business resulting in a rise in their stock prices which is favorable to investors.
On the other hand, if there is an increase in the exchange rate which means that the imports will be cheaper, this situation will benefit the companies using imported goods. Thus, reducing their input costs thereby raising their profits. Such companies will attract the investors to add them to their portfolio.
MACRO EFFECTS (of Past One Year) on Infosys.
COVID – 19 pandemics has its footprints all over Infosys’s annual report of fiscal 2020.
Insecure and bumpy growth in the global economy has had an undesirable impact on the growth of the IT industry. Infosys believes its clients may reduce or postpone their technology spending significantly. This may in turn lower the demand for its services, negatively impacting its revenues and profitability.
CORPORATE SOCIAL RESPONSIBILITIES
Infosys Limited as a corporate has taken up the responsibility for helping the society, along with the company’s aim to focus on the growth of the business as one entity
Infosys Limited has since its inception assumed its primary goal to implement its corporate social responsibilities along with its own sustained economic development as a business unit. It was established in 1996 with an aim not for profit only but with a dedicated thought of community development.
Infosys Foundation works towards removing malnutrition, improving healthcare infrastructure, supporting primary education, rehabilitating destitute individuals, and caring for animals, and preserving Indian art and culture.
Infosys Foundation has associated with non-government organizations (NGOs) to make a difference among local communities with interaction with the people at ground level. The Company’s has always tried to contribute to the sustainable development of the society, environment, and to save our planet for future generations.
References
- https://www.smart-investing.in/main.php?Company=INFOSYS+LTD
- https://economictimes.indiatimes.com/infosys-ltd
- https://www.smart-investing.in/compareStocks.php?Company1=INFOSYS+LTD&Company2=WIPRO+LTD&Company3=TATA+CONSULTANCY+SERVICES+LTD
- https://www.smart-investing.in/compareStocks.php?Company1=INFOSYS+LTD
- https://in.finance.yahoo.com/quote/INFY.BO/financials?p=INFY.BO
- https://www.indiainfoline.com/company/infosys-ltd/peer-comparison/2806
- https://www.valuespreadsheet.com/blog/how-to-determine-a-realistic-growth-rate-for-a-company
- https://efinancemanagement.com/financial-analysis/methods-of-financial-statement-analysis
- https://efinancemanagement.com/financial-analysis/profitability-ratioshttps://www.smart-investing.in/main.php?Company=INFOSYS+LTD
- https://economictimes.indiatimes.com/infosys-ltd/shareholding/companyid-10960.cms
- https://www.sptulsian.com/f/p/current-assets
- https://corporatefinanceinstitute.com/resources/knowledge/finance/financial-ratios/
- Investments by Zvi Bodie, Markus, Alex Kane, Pitabas Mohanty
ACKNOWLEDGMENTS
I deeply thank my mentor Dr. Beryl Chang, Lecturer, Economics and Finance, New York University, for guiding me throughout my project on Investment Analysis in the months of July and August 2021.
About the author
Simran Darak
Simran is an 11th grader who aspires to persue Economics as her major. Apart from academics she is also interested in painting and yoga.