

Author: Han (Dawn) Diao
Mercyhurst Preparatory School
July, 2020
1. Introduction
With the booming of global economies and the develop of societies, the world is changing every single minute. Thus, many considerable issues come to the center of the stage. An important issue is the allocation of public resources to education and progress in the improvement of education across countries of the world. Education, as the base of the society, is a huge topic related to resources allocation and social progress. According to the importance of being educated, not only civilians, but also governments strive for high primary completion rate. To attain the goal, governments in world-wide regions and civilians in different classes pay great prices and obtain interesting results. However, some people may question if the money they put can really promote the education. According to World Data Bank from 1991 to 2016, the progress of the development on education answers the question.
2. Governments’ Expenditure and Primary Completion Rate
2.1 East Asia and Pacific
The track of developing education in each region is different. Because of the diverse basics, experiments, and governments, regions around the world show multiple data according to the governments’ expenditure and primary completion rate. In the region of East Asia and Pacific, the governments’ expenditure gains the development of education. From 1991 to 1999, the government is keeping putting effort on education, but the primary completion rate of different countries is not all comparable. The most typical example is in 1991: some countries’ expenditure is around 7.6%, and their primary completion rate is around 98%, which is greatly high; some countries expenditure is around 16.3%, but their primary completion rate is only around 71%, which is unpredictable low.
From 2000 to 2006, the government expenditure shows a strong linear association with the primary completion rate. The general completion rate is close to 100%. Take 2006 as an example: some countries’ expenditure is around 9%, and their completion rate is around 90%; some countries expenditure is around 22%, and their completion rate is around 98%. The data presented is the lowest one and the highest one in 2006. Both of them show the appreciation of governments to education, and the high primary completion rate.
However, start form 2007, and end in 2009, the situation is not fluent as before. Probably because of the economic crisis in 2007, the primary completion rate begins to decline though governments expend large amount of money on it:
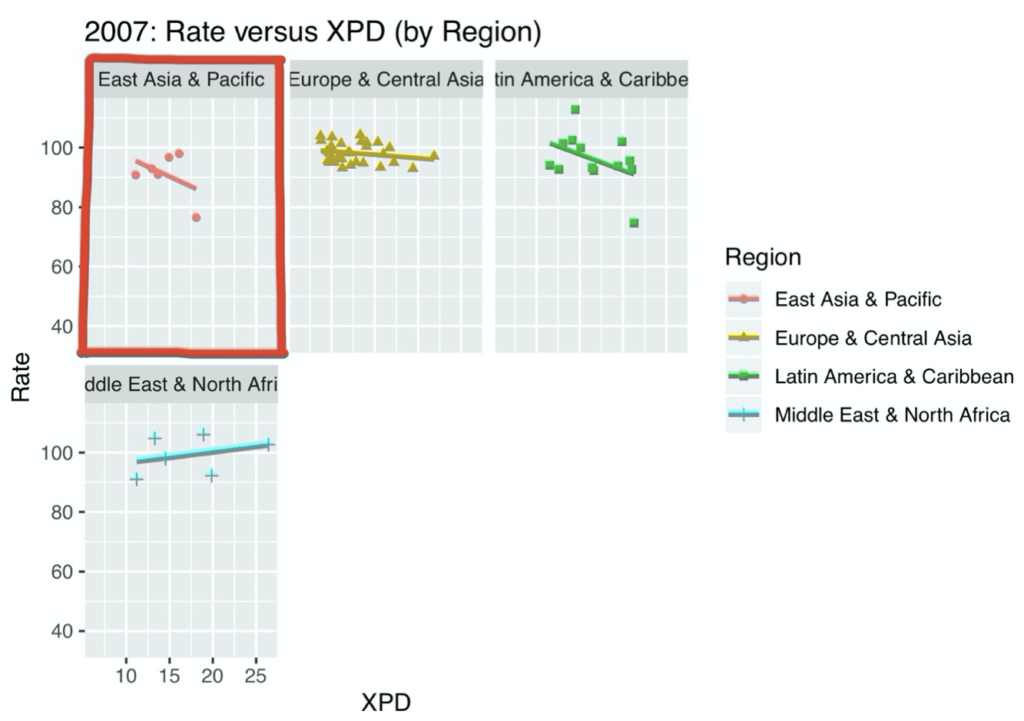
In 2007, some countries’ expenditure is around 17%, which is considerable under the crisis, but the primary completion rate is still around 87%, which is lower than the lowest completion rate in 2006.
After the crisis, which is from 2010 to 2016, the situation is saved. The relationship between governments’ expenditure and the primary completion rate is direct. The more governments spend, the higher completion rate grows. For instance, in 2014, the lowest governments’ expenditure is around 7%, and the primary completion rate is around 92%; the highest governments’ expenditure is around 20%, and the primary completion rate is around 100%. Although the governments’ expenditure from 1991 to 1999 does not win the growth of the primary completion rate, from 2000 to 2006, the rate raises according to the expenditure. During the three year of crisis, to the declined rate, the expenditure is rewarding. Before 2000, governments put lots of money to support education, and the expenditure generally increases with the primary completion rate after 2000.
2.2 Europe and Central Asia
The condition in Europe and Central Asia is a different picture. Because of the difference cultural background and growing process, the data from 1991 to 1994 shows that the completion rate is unstable. The primary completion rate is generally low. Moreover, although the governments’ expenditure is high, it does not help the primary completion rate. Take 1991 as an example: the governments’ expenditure is around 17.5%, but the primary completion rate is only 70%, which is similar to that of East Asia. The same-level primary completion rate between Europe and Central Asia and East Asia illustrates the parallel background they share from 1991 to 1994.
The data from 1995 to 2006 becomes stable to develop. The governments pay attention on education, and the primary completion rate is high. In 2004, for instance, the governments’ expenditures are between 12% to 23%, and the primary completion rates are between 88% to 100%. The high primary completion rate responds to the expenditure.
Different with East Asia, Europe and Central Asia is not impacted by the crisis from 2007 to 2009. Oppositely, the data is quite stable with the almost 100% primary completion rate. From 2007 to 2009, the primary completion rate slightly increases. In 2007, the general rate is around 97%; in 2008, the general rate is around 98%; the general rate is around 99%. The reason behind it maybe the financial relationship between the US and Europe and Central Asia is not as tight as East Asia.
From 2010 to 2016, the governments’ expenditure has direct relationship with the primary completion rate. Take 2015 as an example, the lowest governments’ expenditure is around 8% with the primary completion rate around 97%. The highest governments’ expenditure is around 20% with the primary completion rate around 100%. The development of the expenditure and the education in Europe and Central Asia is generally fluent and stable—notably it is not harmed by the crisis from 2007 to 2009. The primary completion rate respond immediately once governments start to focus on education.
2.3 Latin America and Caribbean
The region of Latin America and Caribbean shows considerable development in education. From 1991 to 1998, the education level between each country is dramatic. The governments’ expenditure on education is balance, but the primary completion rate of each country is not. In 1992, for example, the association between governments’ expenditure and the primary completion rate is positive, and straight with a high outlier, and strong. The lowest governments’ expenditure is around 12%, and the primary completion rate is only 40%; the highest governments’ expenditure is around 15%, and the primary completion rate is around 100%. The close expenditure of each government causes variant rate. Furthermore, according to the data, there are only few countries on it, which is probably because of the imperfection of the education does not allow formal data collecting, or just the data is not collected at the period.
The situation becomes optimistic from 1999 to 2006. Though the plot is moderately strong because of a few outliers, the general rate grows. Take 2003 as an example, the association between governments’ expenditure and the primary completion rate is positive, and straight with a few high and low outliers, and moderately strong. The lowest governments’ expenditure is around 7%, and the primary completion rate is around 92%; the highest governments’ expenditure is around 98%. ‘
From 2007 to 2008, slightly reduce in the primary completion rate is shown. It seems like the economic crisis effects the education in a negative way. Especially in 2008, the association between two variables is negative and straight with a high and a low outlier, and moderately strong. The plot shows that some countries are harmed by the crisis, but others remain stable development.
After 2008, the primary completion rate keeps growing. Although the expenditure is not efficient enough, the general rate is close to 100%. Take 2010 as an example, the association between the governments’ expenditure and the primary completion rate is negative and straight with a few outliers, and moderately strong. The governments’ expenditure is between 13% to 23%, and the primary completion rate is between 90% to 100%. The efficiency of the development on education is not high enough that the governments’ expenditure does not cause absolute high primary completion rate, but the growth on rate is substantial in the region of Latin America and Caribbean.
2.4 Middle East and North Africa
Not only the region of Latin America and Caribbean gets progress on education, but also that of Middle East and North Africa. From 1991 to 1995, the data shows both positive and negative association for each year, which means that the region has typically uncertain primary completion rate. Also, the differences between each country is huge on the governments’ expenditure. Take 1994 as an example, the association between the governments’ expenditure and the primary completion rate is positive and straight with no outlier—because there are only two countries in the plot—and strong. One country has the government’s expenditure that is around 7%, and the primary completion rate that is around 71%; another country has the government’s expenditure that is around 22%, and the primary completion rate that is around 80%. It seems like that one country is trying to develop their education by putting great effort by government, so their expenditure is as high as 22%. However, the general rate is still low.
From 1996 to 1997, it is the most stable period before 2002 that the governments’ expenditure and the primary completion rate is considerable. The association between the expenditure and the rate is positive, and straight with a few outliers, moderately strong. The governments’ expenditure is between 8% to 27%, and the primary completion rate is between 87% to 91%.
From 1998 to 2002, the situation becomes undesirable again. For instance, in 2001, the association between the governments’ expenditure and the primary completion rate is negative, and straight with a low outlier, and moderately strong. The lowest governments’ expenditure is around 10%, and the primary completion rate is around 94%; the highest governments’ expenditure is around 30%, but the primary completion rate is around 60%. The outlier in 2001 is incredible that it has the expenditure of 27% with the rate of 26%.
After 2002, the associations between two variables are generally positive and strong, except for those of 2007 and 2008. In 2007 and 2008, the association is negative with few outliers, and moderately strong. It shows that Middle East and North Africa is also one member of victims from the crisis. Nevertheless, the general growth on education is still great accompanying with the help of governments. Take 2013 as an example, the governments’ expenditure is between 7% to 17%, and the primary completion rate is between 95% to 100%. The decline of the governments’ expenditure indicates the steady of primary completion rate. As another region with huge development on education, it is fair to say that governments’ expenditure cannot be ignored.
2.5 Conclusion
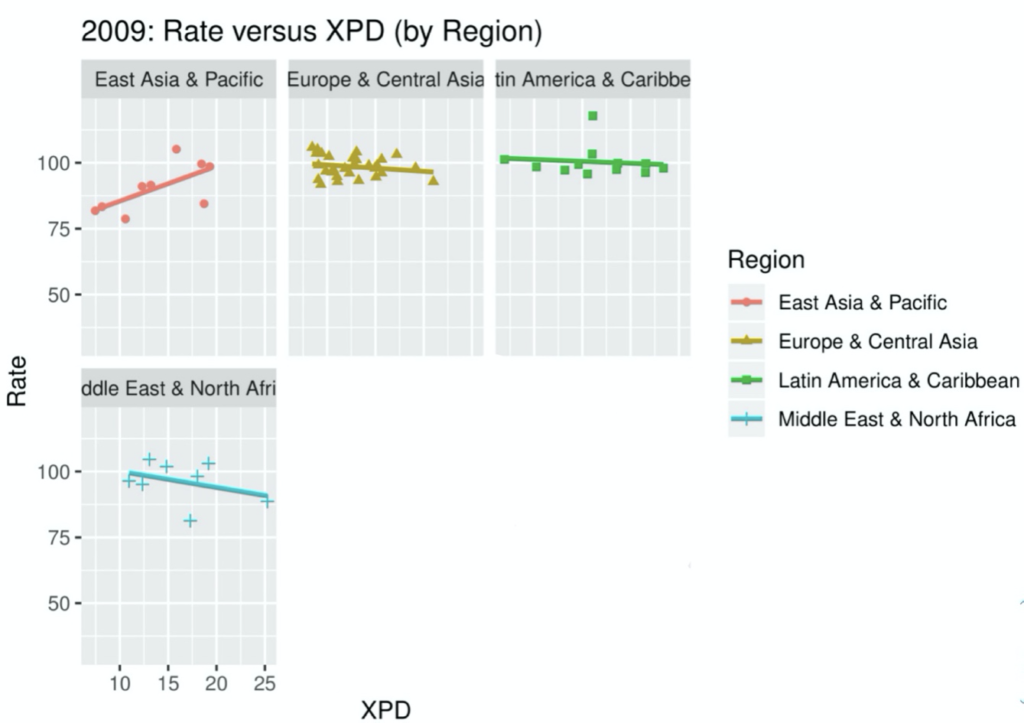
The four regions show the development on education and governments’ expenditure from 1991 to 2016. Every region has its own track: some have unstable education in the beginning, and become stable recently by the support of governments; some have a good beginning with the help of governments, but suffer from the crisis, and overcome it then; some have a government that with sense of paying attention on education all the time that ensure their education is always progressive. Nonetheless, starting from 2009, the development is substantial:
Overall, the governments’ expenditure helps the growth of primary completion rate. Before 2000, the data usually shows inverse relationship between them, which indicates that governments try to increase the rate because the primary completion rate of each region is all close to 100 in the end. Thus, as the time past, governments’ efforts on education promote the primary completion rate.
3. People’s Expenditure and Primary Completion Rate
3.1 Introduction
Governments’ expenditure on education significantly increases the primary completion rate, though it sometimes takes years to see the development. Similarly, different income groups, high income, upper middle income, low middle income, and low income, have different degrees of expenditure. Is their expenditure on education also helpful?
3.2 High Income Group
High income group, as the group of people who are most able to complete high-level education, always remains high primary completion rate. From 1991 to 1999, the general primary completion rate is high, but the associations are not strong enough between the expenditure ad the rate. For instance, in 1997, the association is positive, straight with many outliers, and moderately strong. The plot on this graph is scattered, instead of tight. It indicates the differences between different families. Some high-income families at this time do not have realize the importance of education, so they do not spend great amount of money on it. However, as the arrival of 21th century, the difference is fading.
From 2000 to 2016, the expenditure and the primary completion rate is impressively high, with straight relationship. Take 2013 as an example, the association is positive, straight, and strong. The lowest expenditure in this year is around 6%, and the primary completion rate is around 99%; the highest expenditure in this year is around 22%, and the primary completion rate is around 100%. The expenditures of different families are still discrepant. The reason behind it might be the wish of new high-income families start to put effort to education under the background of the enlargement of high income group. High income group successfully reduce the differences between each family on the primary completion rate; the low expenditure illustrates the stableness on education of some high-income families, and the high expenditure illustrates the development on that of new high-income families.
3.2 Upper Middle Income Group
To middle income group, most of them are trying to become one of high income group members. They pay great attention on education, trying to create chances for their children to attend higher class. Predictably, the expenditure and the primary completion rate is quite high in upper middle income group (because of the lack of information, the analyze only covers from 1998 to 2016). The data shows the stable and high expenditure and the rate of completion from 1998 to 2016. It is similar to that of high income group that they share high primary completion rate that is close to 100%. However, compared to high income group, upper middle income group does not have the association of two variables of upper strong enough. For example, in 2006, the association is negative, straight with some outliers, and moderately strong. The high income group in 2006, on the other head, has the association that is positive, straight, and strong. Upper middle income group already have a general high-level sense of education, but there are still some families do not realize that. The immature sense causes the differences between upper middle income group and high income group.
3.3 Lower Middle Income Group
Lower middle income group presents interesting data, which indicates the complicated and diverse background of different lower middle income group. From 1991 to 1995, the primary completion rate is low, though the expenditure is moderate. Take 1994 as an example, the association between the expenditure and the primary completion rate is negative, straight with few outliers, and moderately strong. The expenditure is between 6% to 23%, and the primary completion rate is between 89% to 60%, which is close to 90%, but is still not a high rate.
Start from 1996, the rate increases that even close to 100%. However, the association between two variables is weak, or there is no association. Some families in lower middle income pay attention on education, but some do not. Take 2015 as an example:
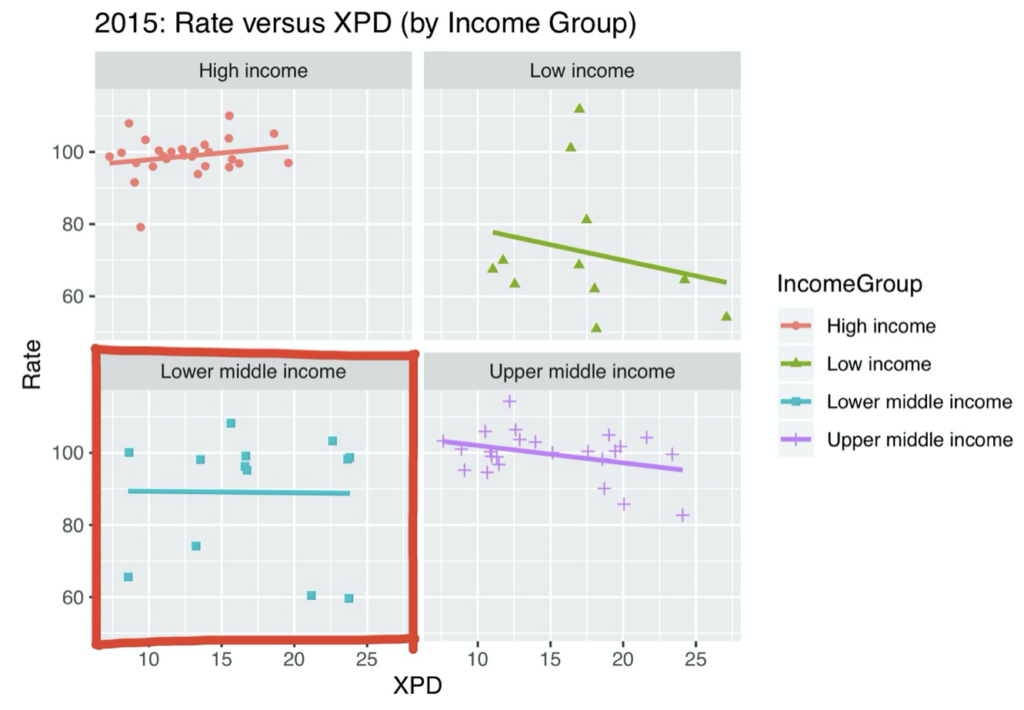
According to the plot, it is hard to analyze the association between the expenditure and the primary completion rate. Every family put different effort on supporting education, and the rate is also unrelated with each other. Although the general primary completion rate is not low, it is still hard to tell if the situation is positive or negative because of the gap between each family.
3.4 Low Income Group
Low income group, as a group with weakest financial condition, reflects some essential social problems. Not surprisingly, the group have low primary completion rate. However, the expenditure is in the average. It is probably because of their low income, so affording common education is not easy actually. Until 2016, their general completion rate is still around 70%. There are many countries have already made the primary education free, so why the rate is remains low, and the expenditure remains in average? It is reasonable for other income group that they want to give their children better education, like going to private schools for education, and so on. However, why the situation comes to the low income group people? The question probably can be given to the government.
3.5 Conclusion
In a society that some groups can have the primary completion rate nearly 100%, and some groups can only have the primary completion rate around 70%, there must be some problems. Are the resources allocated well? Does the education system need to be improved? Yet we are still in the progress of development, but as we can see, though we need to spend huge amount of money for years, the association between governments’ and people’s expenditure and primary completion rate is ultimately straight upward. Thus, because of the optimistic result of the expenditure, the society is encouraged to put more effort on education. It is unrealistic to keep the primary completion rate 100% to every income group, but trying to balance each group is what we should focus on.
Works Cited
Mentor: Dr. Peter Kempthorne
Massachusetts Institute of Technology
“GDP (Current US$) – High Income.” Data, data.worldbank.org/indicator/NY.GDP.MKTP.CD?locations=XD.
“GDP (Current US$) – Low Income.” Data, data.worldbank.org/indicator/NY.GDP.MKTP.CD?locations=XM.
“GDP (Current US$) – Lower Middle Income.” Data, data.worldbank.org/indicator/NY.GDP.MKTP.CD?locations=XN.
“GDP (Current US$) – Upper Middle Income.” Data, data.worldbank.org/indicator/NY.GDP.MKTP.CD?locations=XT.
“Government Expenditure on Education, Total (% of Government Expenditure).” Data, data.worldbank.org/indicator/SE.XPD.TOTL.GB.ZS.
“Primary Completion Rate, Total (% of Relevant Age Group).” Data, data.worldbank.org/indicator/SE.PRM.CMPT.ZS.
About the author

Dawn Diao
Dawn is a rising senior at the Mercyhurst Preparatory School in Erie, Pennsylvania.